

Data Science Math 101: Limits

In the previous post we’ve learned about functions and how they express the relationship between variables. We’ve also visualized a few simple functions on a coordinate plane to see some of their characteristics. If you haven’t read it yet, you might want to do that now.

Next, I’d like to explore the concept of limits as it will help us later understand derivatives. Take a look at the following function:
There’s something very interesting about it. If we plug in some numbers this becomes very apparent. When x = 1, then f(x) = 1. When x = 10, then f(x) = 0.1. When x = 100, then f(x) = 0,01 and so on.
We see, as x grows, f(x) becomes smaller. In fact, it extends into infinity and gets closer and closer to 0 but it never touches it. We can nicely visualize this by plotting this function:
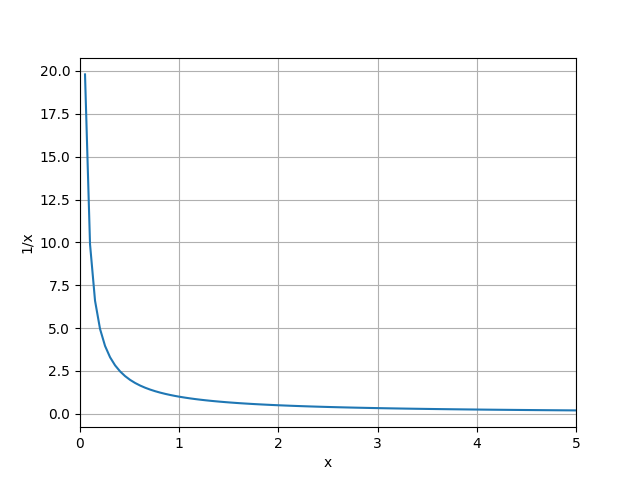
When a function approaches a value but never reaches it, it’s the limit of that function. Here’s how it’s expressed in fancy math syntax.
Which reads as: “as x approaches infinity, the function 1/x approaches 0”.
Up next…
Equipped with the understanding of limits we will continue the journey by exploring derivatives.